NFL Betting Trends: The Complete Data-Driven Guide for UK Punters, 2026 Season
By NFL Betting Trends Analyst

Nine years of tracking NFL betting trends has taught me one thing above all else: the line always tells a story, but most punters never learn how to read it. Every Sunday from September to February, I watch the same patterns repeat — public money flooding in on big-name teams, sharp bettors quietly hammering the other side, and the spread settling at a number that reflects far more information than most people realise. If you are reading this from the UK, you are part of a rapidly growing audience. The NFL now counts more than 14.3 million fans across Britain, and a significant chunk of them are putting real money on games through licensed bookmakers.
This guide is built for you. Not for the American bettor who has wagered on NFL games since childhood, but for the UK punter who watches the London Games live, follows a team through late-night broadcasts, and wants to understand the data behind every spread, total and moneyline. Americans placed $30 billion through legal sportsbooks on the 2025 NFL season, and the global American football betting market has reached $9.5 billion. Those numbers reflect a sport where data-driven wagering has become the standard, not the exception.
What follows is a complete breakdown of every major NFL betting trend category — from ATS records and sharp-versus-public splits to key numbers, situational edges and the UK-specific landscape that shapes how you access these markets. Everything here is grounded in data, interpreted through experience, and written for punters who want sharper decisions.
14.3 million
NFL fans in the UK, with roughly 4 million classed as avid followers
$30 billion
Total legal handle on the 2025 NFL season in the United States, up 8.5% year-on-year
$9.5 billion
Global American football betting market in 2026, growing at 11.5% annually
- The Numbers That Shape Every NFL Wager From the UK
- How NFL Betting Trends Work — And Why They Matter
- ATS Records: The Foundation of NFL Trend Analysis
- Sharp Money vs Public Action: Reading the Splits
- Point Spreads and Key Numbers in NFL Betting
- Over/Under Totals and Moneyline Trend Patterns
- Situational Trends: Home, Away, Rest and Revenge
- How Trends Shift Through the NFL Season
- The UK Betting Landscape: Market, Regulation and Access
- London Games: A Unique Betting Event for UK Fans
- In-Play NFL Betting: Trends in Real-Time Markets
- AI and Data Analytics in Modern NFL Betting
- Bankroll Management: Protecting Your Edge
- Frequently Asked Questions About NFL Betting Trends
The Numbers That Shape Every NFL Wager From the UK
- ATS records — not win-loss records — are the foundation of NFL trend analysis. A team’s cover percentage reveals market mispricing that straight-up results hide.
- When ticket percentage and money percentage diverge by 20+ points, sharp bettors are signalling. That split is one of the most consistent indicators in American football wagering.
- Key numbers 3 and 7 account for roughly 25% of all NFL final margins. Half a point around these numbers changes win probability more than any other factor.
- The UK market is projected to reach $21.3 billion by 2030, with 14.3 million NFL fans and growing live-betting volume. Understanding UK-specific regulation, odds formats and bankroll discipline is not optional — it is the baseline.
How NFL Betting Trends Work — And Why They Matter
I remember the first NFL season I tracked properly — spending hours with spreadsheets open, manually logging cover rates for every team, every week. It felt tedious at the time. But by Week 12, I had spotted something that changed my entire approach: two teams with identical win-loss records but wildly different ATS performances. One was covering at 72%, the other at 31%. The win column told you nothing. The trend data told you everything.
What is a betting trend? A betting trend is a statistically observable pattern in wagering outcomes over a defined sample. It might be a team’s record against the spread over a season, the percentage of public money landing on favourites in prime-time games, or the frequency with which totals go over in cold-weather matchups. Trends are not predictions — they are historical signals that inform probability assessments.
NFL betting trends matter because American football generates more structured, repeatable data than almost any other sport. Every game produces a final margin, a total points figure, and a clear result against the bookmaker’s number. The global sports betting market sits at $111.9 billion with projections of $226.2 billion by 2034. The NFL accounts for a disproportionate share because no other sport offers this volume of quantifiable wagering data. As Bill Miller, president of the American Gaming Association, has noted, legal sports betting enhances the traditions that make NFL games special — and the analytical side of that engagement is what turns trends into a practical tool.
Before going further, a few terms that will appear throughout this guide need defining.
ATS (Against the Spread) — a team’s record relative to the point spread set by bookmakers. A team that “covers” beats the spread; a team that fails to cover loses against it. ATS records are the single most common metric in NFL trend analysis.
Cover percentage — the proportion of games in which a team beats the spread. A cover percentage above 50% over a meaningful sample suggests the team has been undervalued by the market.
Handle — the total amount of money wagered on a given event or over a given period. The 2025 NFL season generated a $30 billion handle through legal US sportsbooks alone.
Trends operate on different timescales. Some are seasonal — a team’s full-year ATS record. Others are situational — how road underdogs perform in divisional matchups, or what happens to totals in high-wind conditions. The skill is not in finding trends. Any tracking site can show you a table. The skill is knowing which trends have predictive value and which are noise dressed up as signal. That distinction runs through every section of this guide.
ATS Records: The Foundation of NFL Trend Analysis
If I had to pick one number to evaluate before placing any NFL wager, it would be the ATS record. Not the team’s win-loss record. Not their scoring average. Their record against the number — because that is where the market’s opinion meets reality, and the gap between the two is where value lives.
ATS records measure something fundamentally different from straight-up results. A team can go 13-4 and still have a losing ATS record if the bookmakers consistently set the spread too high. Conversely, a 7-10 team can be an ATS goldmine if the market underestimates them week after week. The 2025 NFL season produced dozens of these mismatches — teams whose public perception and spread performance pointed in opposite directions.
50%
The theoretical breakeven cover rate — anything consistently above this signals market inefficiency
$1.76 billion
Wagered on Super Bowl LX alone, where ATS analysis shaped the majority of spread bets
16-17 games
The regular-season sample size per team — small enough to create volatility, large enough to reveal patterns
What makes ATS data valuable is its granularity. You can slice it by home-away splits, conference, opponent quality, rest advantage, time of season. Each filter narrows the sample but sharpens the signal. A team covering 60% overall is interesting. A team covering 75% as a home underdog in divisional games is actionable.
The challenge is sample size. A 17-game regular season is not a large dataset. Three seasons gives you roughly 50 data points per team, which approaches statistical significance for broad trends. But the moment you layer filters — home, underdog, prime time, after a bye — you can end up with five or six games. That is not a trend. That is coincidence wearing a pattern’s clothing.
I treat ATS records as directional indicators, not betting signals in isolation. They tell me where to look, not what to bet. The real edge comes when an ATS trend aligns with other factors — sharp money movement, an unpriced matchup advantage, or a situational angle the bookmaker’s model is slow to capture. For a deeper breakdown of team-by-team ATS records and how to build them into a systematic approach, see the full analysis of NFL ATS trends.
ATS records tell you how teams have performed against the number. But the next question is equally important: who is driving those numbers — the sharp bettors or the general public?
Sharp Money vs Public Action: Reading the Splits
There is a moment in every NFL week — usually Tuesday or Wednesday, when the early lines open — where I stop looking at the numbers and start watching the money. Specifically, I watch where the ticket count and the dollar volume disagree. Because when 70% of the public bets are on one side but 55% of the actual money is on the other, something interesting is happening. Someone with serious capital is betting against the crowd, and that divergence is one of the most reliable signals in NFL wagering.
The UK market processes roughly 290 million online bets every month across all sports, with NFL representing a growing slice. But regardless of the total, the dynamic is the same: public bettors follow narratives, sharp bettors follow value. The public backs the team that just won three straight. The sharp bettor checks whether the line has crossed a key number and takes the other side.
Public Action
Measured by ticket percentage — the number of individual bets placed on each side. Public bettors tend to favour home teams, favourites and teams with recent momentum. They react to what they saw last week.
Sharp Action
Measured by money percentage — the total dollar volume on each side. Sharp bettors place fewer, larger wagers. They focus on closing-line value and often bet against popular sentiment. They react to what the numbers say this week.
The core split — ticket percentage versus money percentage — is the heartbeat of NFL betting analysis. Commissioner Roger Goodell has said repeatedly that protecting the sport’s integrity is his highest priority, and that integrity extends to the betting markets. When sharp and public money diverge, the line moves — and that movement tells you which side the bookmaker respects more.
The 20% divergence threshold. When the gap between ticket percentage and money percentage on one side exceeds 20 percentage points, it signals significant sharp-side positioning. For example, if 65% of tickets are on Team A but only 40% of the money, the 25-point gap suggests sharp money is heavily on Team B. This is not a magic trigger, but in my experience, divergences above 20% deserve attention far more often than they deserve dismissal.

One misconception I encounter constantly: people assume “sharp money” means insider information. It does not. Sharp bettors are more disciplined, better capitalised, and more systematic. They build models, track closing-line value, and bet in volumes that force the bookmaker to adjust. The information is available to everyone — the difference is in how it gets processed.
For UK punters, accessing reliable split data can be trickier than it is for American bettors. But the principles are identical, and sharp-versus-public divergence remains one of the most consistent edges in American football wagering. I explore the methodology and step-by-step workflow in the full guide to NFL sharp vs public betting.
Point Spreads and Key Numbers in NFL Betting
Early in my career tracking NFL lines, I made a bet on a team favoured by 3.5 points. They won by exactly 3. I lost, obviously, but the experience burned a concept into my brain that I have never forgotten: in NFL betting, half a point is not a rounding error. It is the difference between a win and a loss, and some numbers matter far more than others.
Point spreads are the most popular NFL bet type for a reason. They level the playing field between mismatched teams and create a 50-50 proposition — at least in theory. The bookmaker sets a number, and you decide whether the favourite will win by more than that margin or the underdog will keep it closer. Simple in concept, endlessly complex in practice. Super Bowl LX demonstrated this perfectly, drawing $1.76 billion in legal wagers, the majority of which were spread-related.
The concept of “key numbers” is what separates a casual spread bettor from an informed one. NFL games end with certain margins far more often than others, and those margins cluster around specific numbers.
| Key Number | Decimal | Fractional | American |
|---|---|---|---|
| 3 (field goal margin) | 1.91 | 10/11 | -110 |
| 7 (touchdown margin) | 1.91 | 10/11 | -110 |
| 10 (FG + TD margin) | 1.91 | 10/11 | -110 |
The table above shows standard vig pricing, but the real point is about the numbers themselves. Roughly 15% of all NFL games land on a final margin of exactly 3 points. Another 9-10% land on exactly 7. The difference between getting a team at -2.5 versus -3.5 is enormous — one number captures that 15% cluster; the other does not.
Nearly 1 in 4 NFL games finishes with a final margin of exactly 3 or 7 points. These two key numbers alone account for roughly 25% of all outcomes — a concentration that has no equivalent in any other major sport.
For UK punters accustomed to fractional odds and football markets, the spread concept takes adjustment. In a Premier League match, you bet on a team to win at 6/4. In the NFL, you bet on a team to win by more than a specific number — or lose by fewer. The odds are typically close to even on both sides (-110 American, 10/11 fractional, 1.91 decimal), because the spread itself equalises the two outcomes.
Line shopping — comparing the spread offered by different bookmakers — becomes critical around these key numbers. If one UK bookmaker has a team at -3 and another at -2.5, the second line is meaningfully better. That half-point crosses the most common final margin in the sport. Over a full season, consistently securing the best number around 3 and 7 adds measurable value. The full mechanics of spread analysis, key number frequencies and line-shopping strategy are covered in the dedicated NFL spread trends guide.
Over/Under Totals and Moneyline Trend Patterns
Here is something that surprised me when I first dug into the data: totals markets in the NFL have historically been softer than spread markets. By “softer,” I mean there is more inefficiency — more room for a well-informed bettor to find value. Why? Because while everyone obsesses over which team will cover, fewer people scrutinise the combined scoring total with the same rigour. That asymmetry creates opportunity.
Totals (Over/Under) — a wager on whether the combined final score of both teams will exceed or fall below a number set by the bookmaker. If the total is set at 47.5 and the game finishes 27-24 (51 total points), the over wins.
Moneyline — a straight-up bet on which team will win the game, with no spread involved. The favourite pays less than even money; the underdog pays more. A moneyline of -180 means you risk 180 to win 100; a moneyline of +160 means you risk 100 to win 160.
Totals trends in the NFL are influenced by stylistic matchups, weather and game pace. The edge, when it exists, comes from situations where the bookmaker’s adjustment is incomplete or where public perception of a team’s firepower lags behind the data.
Totals bet calculation.
The total for a Sunday game is set at 44.5, both sides priced at 1.91 decimal (10/11 fractional, -110 American).
You place a 10-unit wager on the over. Game finishes 28-21 (49 total). Return: 10 x 1.91 = 19.1 units. Profit: 9.1 units.
Game finishes 17-13 (30 total). Loss: 10 units.
At 1.91 odds, you need to win 52.4% of totals bets to break even after the bookmaker’s margin.
Live betting has reshaped totals wagering. In-play markets now account for 53.4% of all bets globally — the first time live wagering has surpassed pre-match. For totals, this means you can watch the first quarter, assess actual pace and play-calling, and decide whether the pre-game total was accurate. A game opening at 48.5 that sees both teams punt their first three drives will often see the live total drop to 42 or 43 by halftime, creating value on the over if you believe the second half will revert to expected scoring rates.
Moneyline trends operate on a different axis. When is it more profitable to bet on a team to win outright than to cover the spread? The answer: when the price differential does not reflect the actual probability gap. Small underdogs — teams at +1 to +3 on the spread — often offer better moneyline value because the payout is disproportionately generous. Large underdogs are almost always better value on the spread, where a close loss still counts as a win.
Situational Trends: Home, Away, Rest and Revenge
A few seasons ago, I had a strong statistical case for backing a road underdog on a Thursday night. The ATS data supported it. The sharp-money splits supported it. But the team was travelling across three time zones on short rest to face a divisional rival. I backed them anyway, because the numbers said so. They lost by 17. That was the week I learned that situational context is not a secondary filter — it is the filter that decides whether any other trend applies at all.
Home Teams
Home-field advantage in the NFL has been declining for over a decade, but home teams still win roughly 55-57% outright. Against the spread, home favourites perform in line with expectations, but home underdogs — teams the market expects to lose but who have crowd support — have been one of the more consistent ATS trends over recent seasons.
Away Teams
Road favourites — teams good enough to be favoured despite playing away — tend to cover slightly above breakeven. The market sometimes overcompensates for home-field advantage. Road underdogs are the most volatile category: inconsistent year to year and highly sensitive to the specific matchup.
International viewership numbers underline just how invested the UK audience has become in these dynamics. NFL international games averaged 6.2 million viewers in 2025, a 32% increase over the previous year. Many of those viewers are watching games where situational factors — the London travel schedule, the time-zone disruption, the unfamiliarity of the venue — play directly into the betting lines.
The rest-day edge. Teams coming off a bye week have historically covered at a slightly elevated rate, typically 53-55%. On the other end, teams on short rest — particularly Thursday Night Football after a Sunday game — tend to underperform against the spread. The physical recovery deficit compresses their ability to execute game-plan adjustments. A bye-week team facing a short-rest opponent is one of the most structurally repeatable edges in NFL wagering.
Revenge games — where a player or coach faces their former team — get enormous media attention and almost no statistical support. I have tracked these matchups for six seasons, and the ATS results are essentially random. The narrative is compelling, which is precisely why the market prices it in before you get to the window.
The situational trends that hold up share a common trait: they reflect structural advantages (rest, home crowd, travel disadvantage) rather than emotional narratives. I have learned to trust the structure and ignore the story.
How Trends Shift Through the NFL Season
Ask me in September which teams will cover the most games, and I will give you a list. Ask me again in November, and half that list will be different. The NFL season is not one long dataset — it is four distinct phases, each with its own trend characteristics, and treating them as a single block is one of the most common analytical mistakes I see punters make.
The four phases of the NFL season.
Weeks 1-4 (Early Season) — Maximum uncertainty. Roster changes and limited game film make prior-season trends unreliable. Public money overreacts to preseason narratives.
Weeks 5-12 (Mid-Season) — Data stabilises. Teams reveal their identity. Current-season ATS trends become meaningful.
Weeks 13-18 (Stretch Run) — Motivation diverges. Playoff contenders play with urgency; eliminated teams rest starters. Lines struggle to price these intention gaps.
Playoffs (Wild Card to Super Bowl) — Tiny samples, high stakes. Every remaining team is competent. ATS patterns lose predictive power, but totals have historically leaned under.
The global American football betting market grew from $8.52 billion to $9.5 billion between 2025 and 2026, and that growth comes partly from bettors extending their engagement across the full season rather than dropping in for marquee weeks only.
Here is what I have observed across nine seasons. Early-season ATS data is essentially a coin flip — the market has not figured out who teams are yet. By mid-season, persistent ATS trends emerge for structural reasons (a defence that forces close games, an offence that controls clock) rather than variance. These mid-season trends are the most actionable of the entire year.
The stretch run introduces motivation as a variable no model captures perfectly. A team locked into a playoff position may rest key players in Week 17 or 18 while their opponent, fighting for a wild-card spot, plays with desperation. The line often fails to adjust for this intention gap, creating one of the most fertile periods for finding value.
Playoff trends deserve the most scepticism. Sample sizes are tiny, quality compression is extreme, and historical ATS patterns are dangerous to bet on as if they were reliable. The one exception: postseason games lean under at a rate that has been remarkably consistent over the past decade, driven by heightened defensive intensity and conservative play-calling.
The UK Betting Landscape: Market, Regulation and Access
When I started covering NFL betting trends, I wrote primarily for an American audience. The UK readership was negligible. Five years on, it is the fastest-growing segment, and for good reason: the UK has the infrastructure, the regulatory framework and the growing fan base to support serious NFL wagering. But the landscape here is different from the US in ways that matter to every punter reading this guide.
GBP 16.8 billion
Total gambling industry GGY in the UK (April 2024 – March 2025), up 7.3% year-on-year
13.5 million
Average monthly active online gambling accounts in the UK
GBP 100 million
Annual funding for gambling harm research and treatment via the 2025 statutory levy
The UK gambling market generated GBP 16.8 billion in gross gambling yield in the year to March 2025, with sports betting accounting for GBP 2.48 billion annually. One in ten UK adults bets on sport online, 13.5 million online accounts are active each month, and the market is projected to reach $21.3 billion by 2030. These are not niche figures — they describe a mainstream activity regulated by one of the most established frameworks in the world.
For NFL punters specifically, the UK market offers choice — multiple UKGC-licensed bookmakers carry spreads, totals, moneylines, futures, props and in-play options. The limitation is depth: NFL markets are typically less liquid than at major US sportsbooks, meaning wider lines and lower limits. Understanding this dynamic is essential.
The regulatory environment has shifted significantly. The statutory gambling levy, introduced on 6 April 2025, charges online operators 1.1% of their gross gambling yield to fund research, prevention and treatment. The government is committing GBP 100 million annually to tackle gambling-related harm. The 2025 reforms, as legal analysts at Clifford Chance noted, position the UK as a global leader in responsible gambling regulation.
Responsible gambling matters. 10% of UK adults bet online on sport, and 2.5% of the population is directly affected by problem gambling — more than 1.5 million people. Every UKGC-licensed bookmaker must offer deposit limits, cooling-off periods and self-exclusion tools. Setting a weekly deposit limit before the season costs nothing and protects against tilt-driven decisions.
One area where UK punters need to adjust is odds format. American NFL content uses American odds notation (-110, +150), which is unintuitive for anyone raised on fractional or decimal formats.
| Scenario | American | Decimal | Fractional |
|---|---|---|---|
| Standard spread bet (either side) | -110 | 1.91 | 10/11 |
| Slight favourite (moneyline) | -150 | 1.67 | 2/3 |
| Moderate underdog (moneyline) | +200 | 3.00 | 2/1 |
| Large underdog (moneyline) | +450 | 5.50 | 9/2 |

The conversion principle is straightforward. For negative American odds: divide the number by itself plus 100 to get implied probability. For positive: divide 100 by the number plus 100. In practice, I recommend setting your bookmaker account to decimal odds — the clearest format for calculating returns and comparing prices across platforms. The full picture of navigating UK bookmakers, odds formats and UKGC rules is covered in the NFL betting UK guide.
London Games: A Unique Betting Event for UK Fans
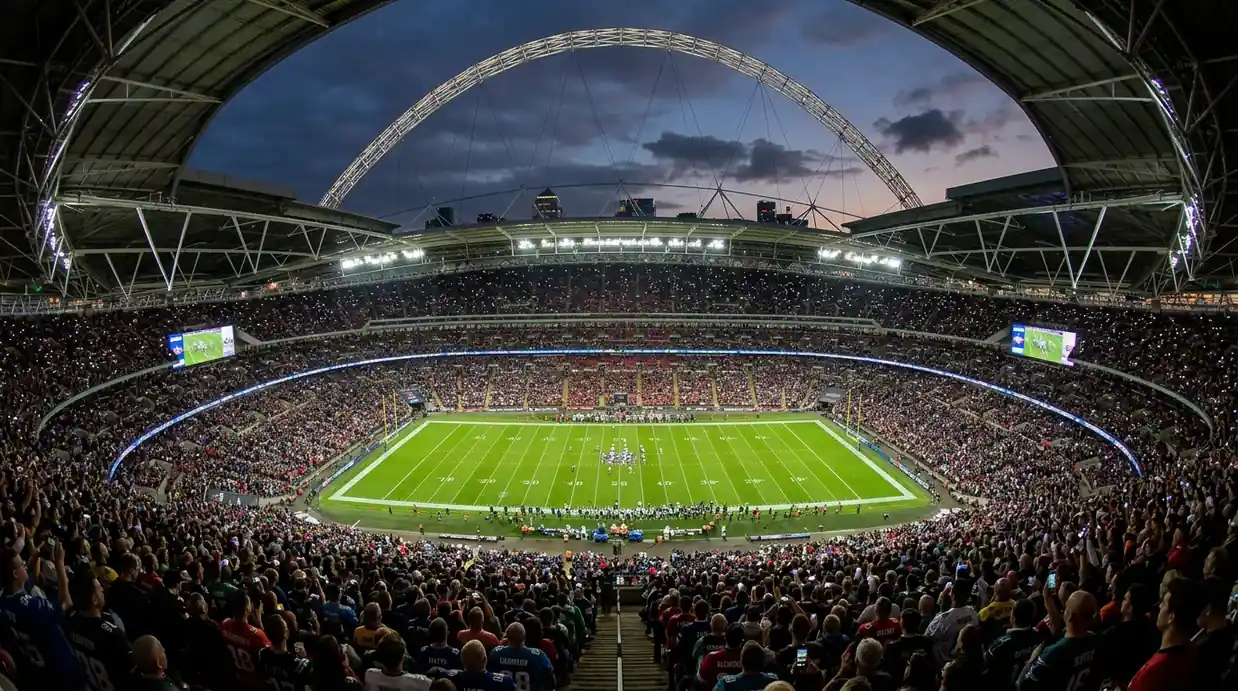
I was at Wembley for one of the 2024 London Games, sitting in the upper tier with 86,000 other people watching two NFL teams play a regular-season game on British soil. The atmosphere was unlike anything I had experienced at an American sporting event: louder, more diverse, genuinely electric. And the betting angles were unlike anything in the standard NFL calendar, too.
86,651 spectators attended the Wembley NFL game in October 2024 — a record for any NFL match played outside the United States.
London Games are not just another fixture. They are a distinct betting event. The NFL has hosted regular-season games in London since 2007, welcoming more than 3 million fans. Henry Hodgson, the NFL’s UK and Ireland general manager, has called London a world-class sport and entertainment destination. Commissioner Roger Goodell has described the fan reaction in the UK as extraordinary, saying the league’s goal is to make the NFL a global sport.
For bettors, the variables that make London Games unique are structural. Both teams travel — there is no true “home” advantage. The travel schedule varies: some teams arrive early and adjust; others fly in Thursday. Jet lag, disrupted preparation and unfamiliar surfaces introduce noise into performance data.
The UK’s NFL fan base — 14.3 million strong, with 68% aged 18 to 44 — creates a genuinely neutral crowd. The audience cheers big plays from either side, removing the home-field factor the bookmaker would normally price in. This neutrality, combined with the travel variables, means London Game spreads are set differently from standard matchups.
More than 6 million people watched the 2025 London Games on television or online. That viewership is translating directly into wagering volume on UK platforms. London Games have become an on-ramp: fans who watch live at Wembley or Tottenham Hotspur Stadium are precisely the audience most likely to place their first NFL bet.
London Games show how location and scheduling shape NFL betting trends. But the biggest shift in how punters engage with these markets is not about where the game is played — it is about when the bet is placed.
In-Play NFL Betting: Trends in Real-Time Markets
The first time I placed a live NFL bet, I got the worst possible education. I backed the over on a totals line that had dropped sharply after a scoreless first quarter, convinced the scoring would come. It did not. What I did not understand then — and what took me another full season to properly grasp — is that live markets are not just pre-game markets with updated numbers. They are a fundamentally different beast, with their own dynamics, their own inefficiencies, and their own traps.
What is live (in-play) betting? Live betting allows you to place wagers on an NFL game while it is in progress. The odds update continuously based on the score, time remaining, possession, field position and other in-game variables. Spread, totals and moneyline markets are all available in-play, along with proposition bets on the next drive, next score, and individual player performance.
53.4% of all bets placed globally in 2026 are live wagers — the first time in-play betting has surpassed pre-match as the dominant form of sports wagering.
That 53.4% figure is significant. The majority of money flowing through global sportsbooks is now placed while games are happening. Mobile devices drive this: 80% of US bets and 53.65% globally come from phones or tablets. For UK punters watching NFL on a Sunday evening, the phone in your hand is the sportsbook, and the temptation to react to every momentum swing is constant.
A few patterns have emerged from the data. Live spreads tend to overreact to early-game scoring — a team that scores two quick touchdowns sees their live spread balloon beyond what the full-game outcome will justify, creating value on the trailing side. Live totals swing dramatically after a few possessions, and the punter who waits for a slow start to drive the live total down before backing the over has a measurable edge over the one who bets pre-game blindly.
Platforms embedding live streaming directly into the betting experience have seen user engagement rise by 25%. But volume is not value. The speed at which live odds adjust means the window to act is narrow — sometimes seconds. For UK punters on a slight broadcast delay, this latency creates an additional challenge. The full breakdown of live betting strategy and quarter-by-quarter patterns is in the NFL live betting trends guide.
AI and Data Analytics in Modern NFL Betting
Three years ago, I started running a basic predictive model for NFL spreads — nothing sophisticated, just logistic regression on a handful of performance variables. It beat my subjective picks by 4% over the season. That modest improvement taught me something profound: the value of systematic analysis is not in the complexity of the model but in the consistency of removing human bias from the process. The professionals, unsurprisingly, have been doing this at an entirely different scale for years.
The Genius Sports partnership. The NFL’s official data partner, Genius Sports, provides integrity services for every game. The league granted Genius 18.5 million shares in the 2021 deal, with 4 million more upon the 2023 extension. The real-time data feeding bookmaker models — play-by-play, player tracking, situational metrics — flows through this single, league-controlled pipeline.
AI has reshaped NFL betting at every level. Bookmakers use machine-learning models to set opening lines, adjust them in real time, and identify sharp-action patterns. The global sports analytics market is projected to exceed $22 billion by 2030, driven largely by AI applications. For the individual bettor, this means the market has become more efficient — lines are sharper, edges are thinner, and the margin for error has compressed.
What does this mean for punters? AI-powered models do not eliminate opportunity — they shift where it exists. Obvious inefficiencies are corrected faster, but subtle ones remain: situational trends the models miss, motivational factors that defy quantification, weather impacts on specific play styles. The punter who understands what the model captures and what it misses has a genuine advantage.
This convergence plays out in real time. The bettor watches a game, sees data update, and acts within the same interface — a setup that favours the disciplined and punishes the impulsive. The speed of AI-adjusted odds means that the punter who reacts emotionally loses ground to the punter who has a framework for identifying when the algorithm has overcorrected.
I am not a machine-learning engineer. My models are basic compared to what bookmakers deploy. But I do not need to beat their model outright. I need to find the spots where it is weakest — small-sample situational trends, late-breaking injury news, games where the motivational context defies quantification — and concentrate my wagering there. That approach, working with AI-era efficiency rather than against it, is what keeps trend-based analysis relevant.
Bankroll Management: Protecting Your Edge
I know punters who can identify value in an NFL line better than I can. They read trends, they track sharp money, they understand key numbers. And they still lose over a season. Every time, the reason is the same: they have no bankroll discipline. A 55% ATS win rate — which is genuinely excellent — still means losing 45% of your bets. If your staking plan cannot absorb a seven-game losing streak, which will happen, the edge never has time to compound.
The numbers on gambling harm underscore why this matters. In the UK, 2.5% of the adult population — more than 1.5 million people — is directly affected by problem gambling. Globally, roughly 450 million people experience some form of gambling-related harm. The government is investing GBP 100 million annually through the statutory levy to fund research, prevention and treatment.
Five steps before your first bet of the season
- Define your total bankroll — the maximum amount you are prepared to lose over the entire NFL season. This is money you do not need for any other purpose.
- Set your unit size at 1-2% of that bankroll. A GBP 1,000 bankroll means GBP 10 to GBP 20 per unit, enough to sustain a 20-bet losing streak.
- Establish a weekly cap. Three to five units per NFL week is a reasonable ceiling for most punters.
- Set deposit limits on your bookmaker account before the season begins. Every UKGC-licensed operator offers daily, weekly and monthly controls.
- Record every bet — date, game, bet type, odds, stake, result. Two minutes per bet gives you the data to evaluate your approach over time.

Responsible gambling is not a footnote. If your betting is causing stress, if you are chasing losses with larger stakes, or if people around you are expressing concern — stop. UK bookmakers offer self-exclusion through GAMSTOP, cooling-off periods, and support service links. The National Gambling Helpline (0808 8020 133) is free, confidential and available 24 hours a day.
Flat staking — betting the same unit size on every wager regardless of confidence level — is the approach I use and recommend. Variable staking sounds logical but introduces a dangerous feedback loop: your “high-confidence” plays are often the ones where bias is strongest, and increasing stakes amplifies the damage when bias proves wrong. Flat staking removes that temptation. The results reflect your edge rate over the sample, not your ability to predict your own confidence accuracy. Protect the bankroll first, and the edge takes care of itself.
NFL Betting Trends Analyst · Specialising in ATS performance patterns, sharp-money detection, and data-driven wagering strategy across NFL regular and post-season markets. 9 years of experience.
Frequently Asked Questions About NFL Betting Trends
What are NFL betting trends and how do they work?
NFL betting trends are statistically observable patterns in wagering outcomes — team records against the spread, public-versus-sharp money splits, totals relative to posted numbers, and situational data like home-away splits. They work by revealing historical probabilities that inform your assessment of upcoming games. A team covering 62% of home games over three seasons gives you a data-backed starting point. Trends are not predictions — they are probability indicators that gain value when layered with matchup analysis, line movement and current-season form.
How do you read public betting percentages for NFL games?
Public betting percentages consist of two metrics: ticket percentage (the share of individual bets on each side) and money percentage (the share of total wagered dollars). You read them in combination. When 75% of tickets are on Team A but only 50% of the money, small bettors favour that side while larger, typically sharper, bettors lean toward Team B. The wider the divergence between ticket and money percentage, the stronger the signal that sharp action is positioned against the crowd.
What is the difference between sharp money and public money in NFL betting?
Public money comes from recreational punters who tend to bet favourites, home teams and teams riding momentum. Sharp money comes from professional bettors who place fewer, larger wagers based on systematic models and closing-line value. The practical difference: when these two sides disagree, the bookmaker adjusts the line toward the sharp side. The direction the line moves tells you which side the bookmaker respects more.
What are key numbers in NFL point spread betting?
Key numbers are final-score margins that occur most frequently. The two most important are 3 (field goal) and 7 (touchdown plus extra point). Roughly 15% of NFL games finish on a margin of exactly 3, and 9-10% on exactly 7. Other significant numbers include 10, 6 and 14. Key numbers matter because they determine how valuable a half-point line difference is. Getting -2.5 instead of -3.5 crosses the most common margin in the sport and meaningfully changes your win probability.
Does betting against the public actually work in the NFL?
Fading the public has shown a modest positive return over large samples, particularly when public sentiment is extreme — 70% or more of tickets on one side. It works best when the line has not moved toward the popular side (suggesting the bookmaker is comfortable with the exposure) and sharp-money indicators confirm the contrarian position. It is not a blanket strategy. Blindly fading the public every game produces inconsistent results. It works as a filter for identifying games where emotional market tilt has created a pricing gap.
How do NFL betting trends differ for home teams vs away teams?
Home teams win outright at roughly 55-57%, but the bookmaker prices this advantage into the spread. Home underdogs — teams expected to lose but playing in front of their crowd — have been one of the more consistently profitable ATS categories. Home favourites cover at close to the expected rate, offering little edge. Road favourites tend to cover slightly above breakeven, while road underdogs are the most volatile category. The broader trend is that home-field advantage, while still real, has been declining for over a decade.
What are the most profitable NFL betting trends historically?
Several trends have shown positive returns over multi-season samples. Home underdogs covering the spread, particularly in divisional games. Fading the public when ticket skew exceeds 70% with sharp-money confirmation. Totals trending under in cold-weather and high-wind games at outdoor stadiums. Bye-week teams covering against short-rest opponents. And the most structurally sound practice of all: line shopping to secure the best number around key numbers 3 and 7, which compounds across every bet over a full season. The most profitable approach combines multiple confirming factors rather than relying on any single pattern.
Created by the ”nfl Betting Trend” editorial team.